Dashboard
A new customizable hub that gives you personalized insight into tutorial statistics, learner engagement, performance analytics, creator activity, and more.
Your data, your way.
Track tutorial creation, learner engagement, usage trends, and team performance — all in one customizable view.
The dashboard gives you a full picture of how tutorials are being created, shared, and used across your account. See what's working, what's slowing your learners down, and where to focus your e-learning efforts.
Feedback in motion
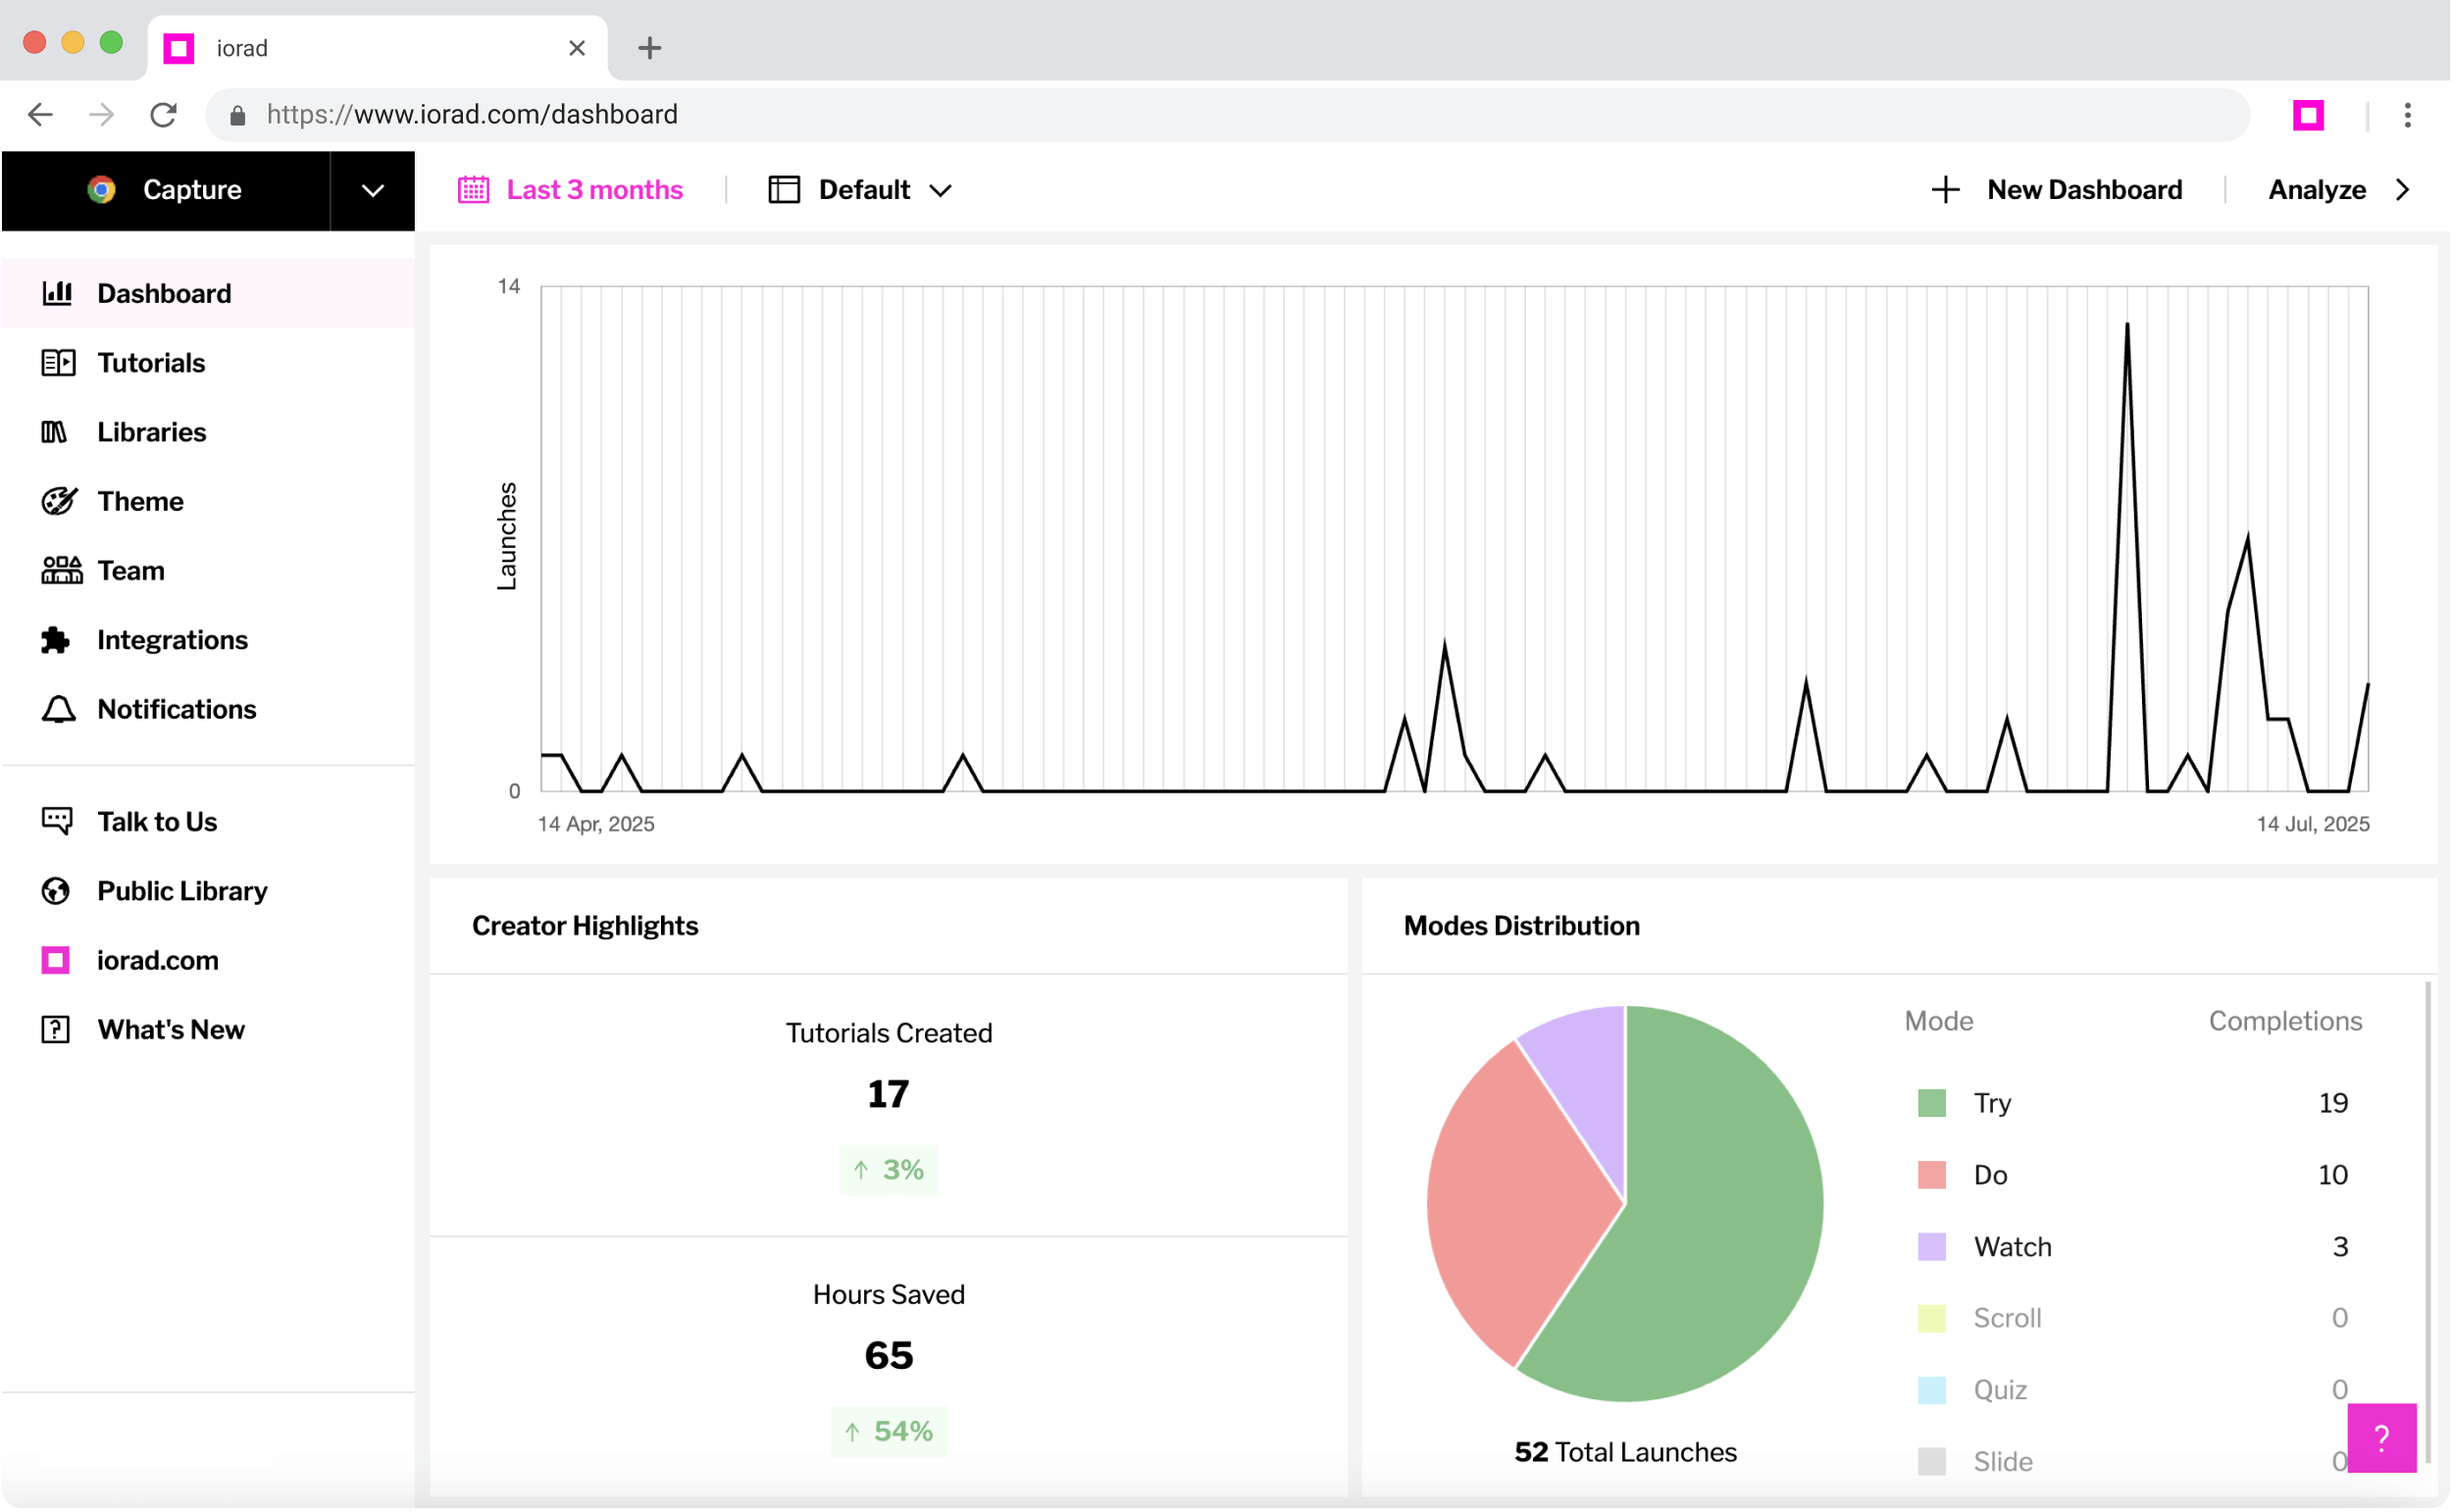
Each widget surfaces a specific slice of insight — tutorial stats, learner behavior, creator activity, and more. Add or remove widgets to keep your dashboard clean and focused.

Launch Chart
See the total amount of times your tutorials have been launched throughout the last month.
Creator Highlights
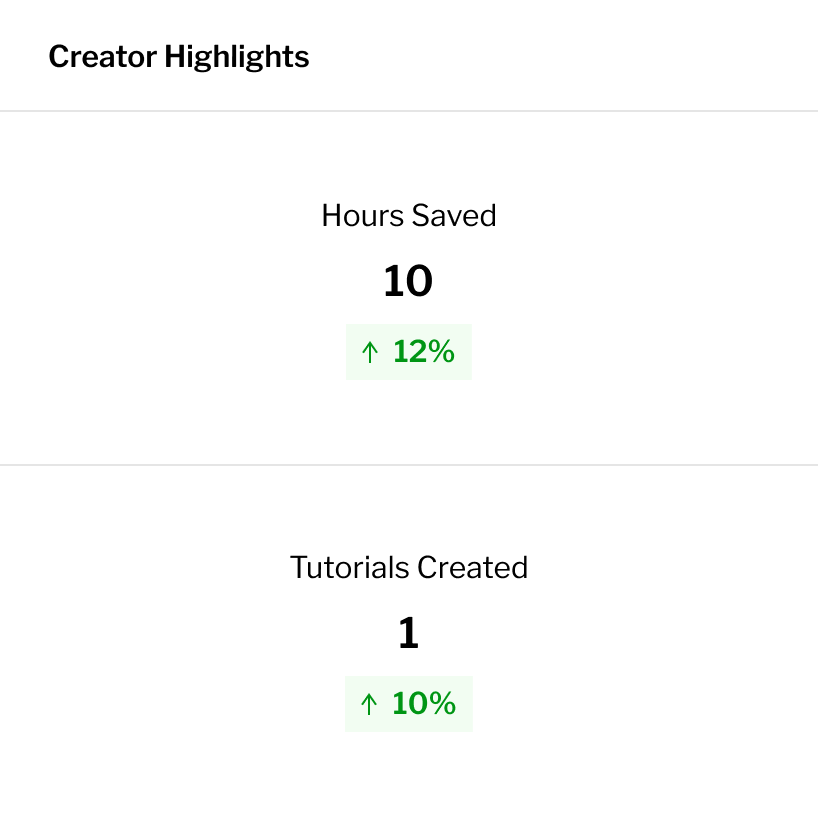
Track the number of tutorials you’ve created and how many hours of time iorad is saving you.
Learner Engagement
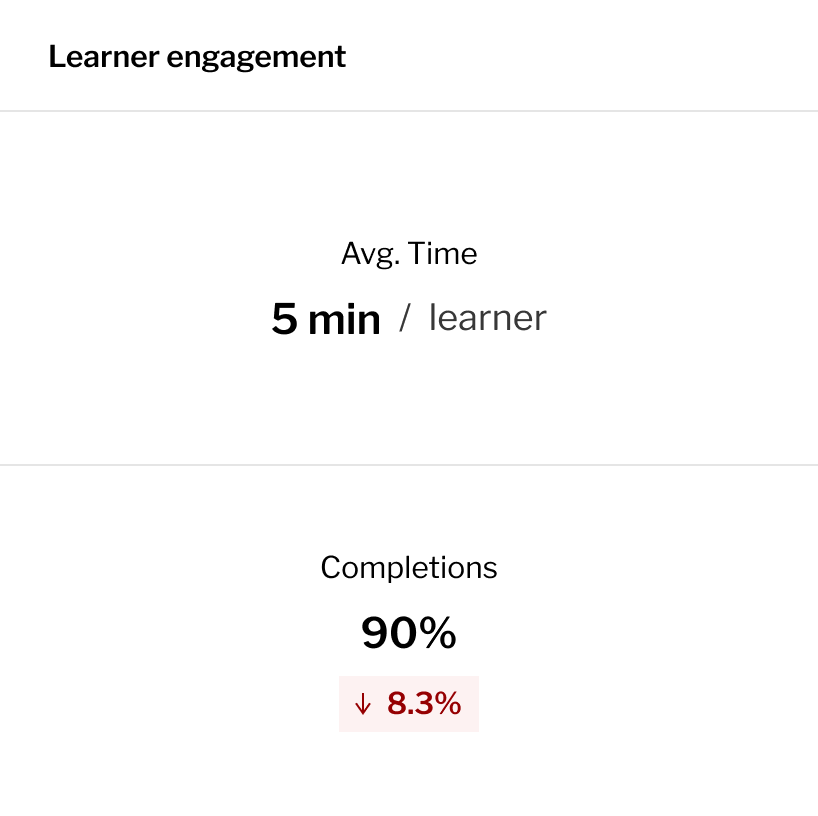
Track the average completion rate of your tutorials and how much time people spend on them.
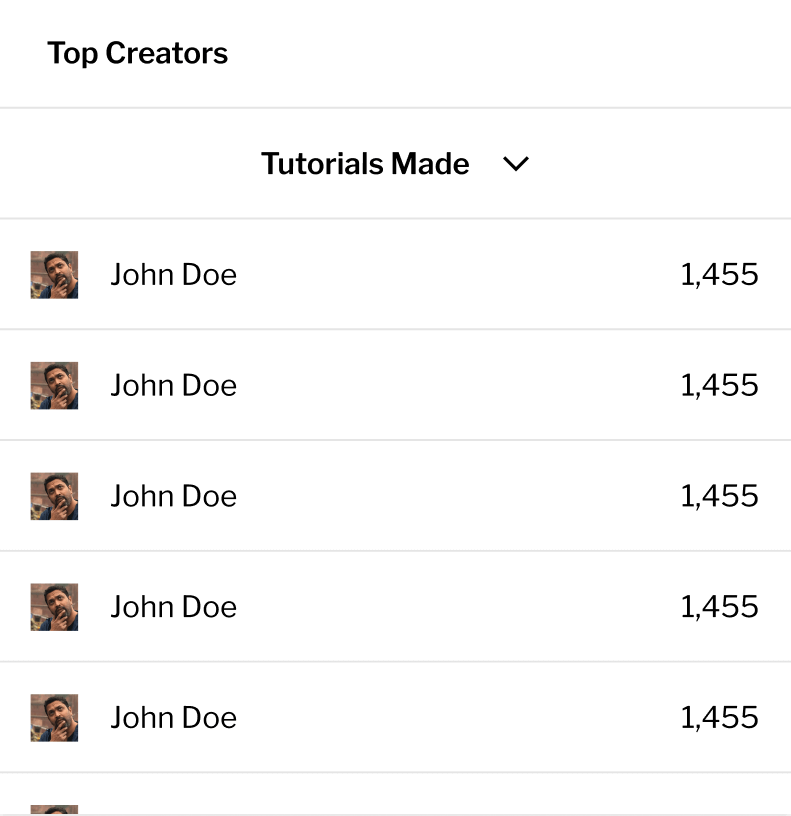
Top Creators
Toggle between tutorials made and tutorial views to see your highest performing team members.
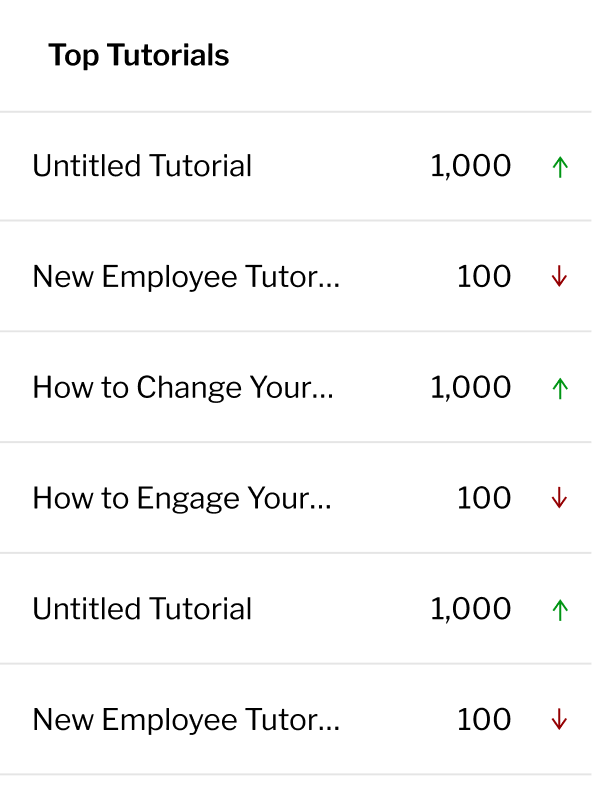
Top Tutorials
See your top performing tutorials at a glance and compare changes in their performance over time.
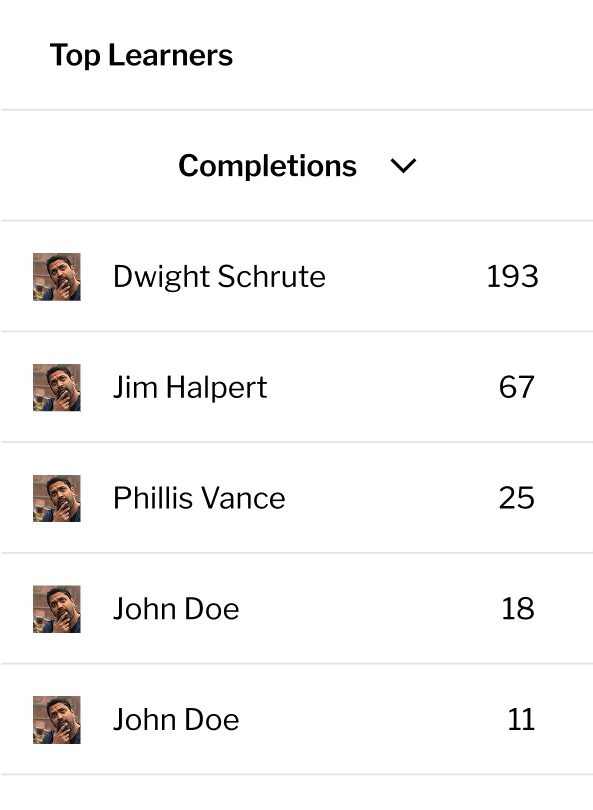
Top Learners
Toggle between completions and launches to see the people who interact with your tutorials the most.
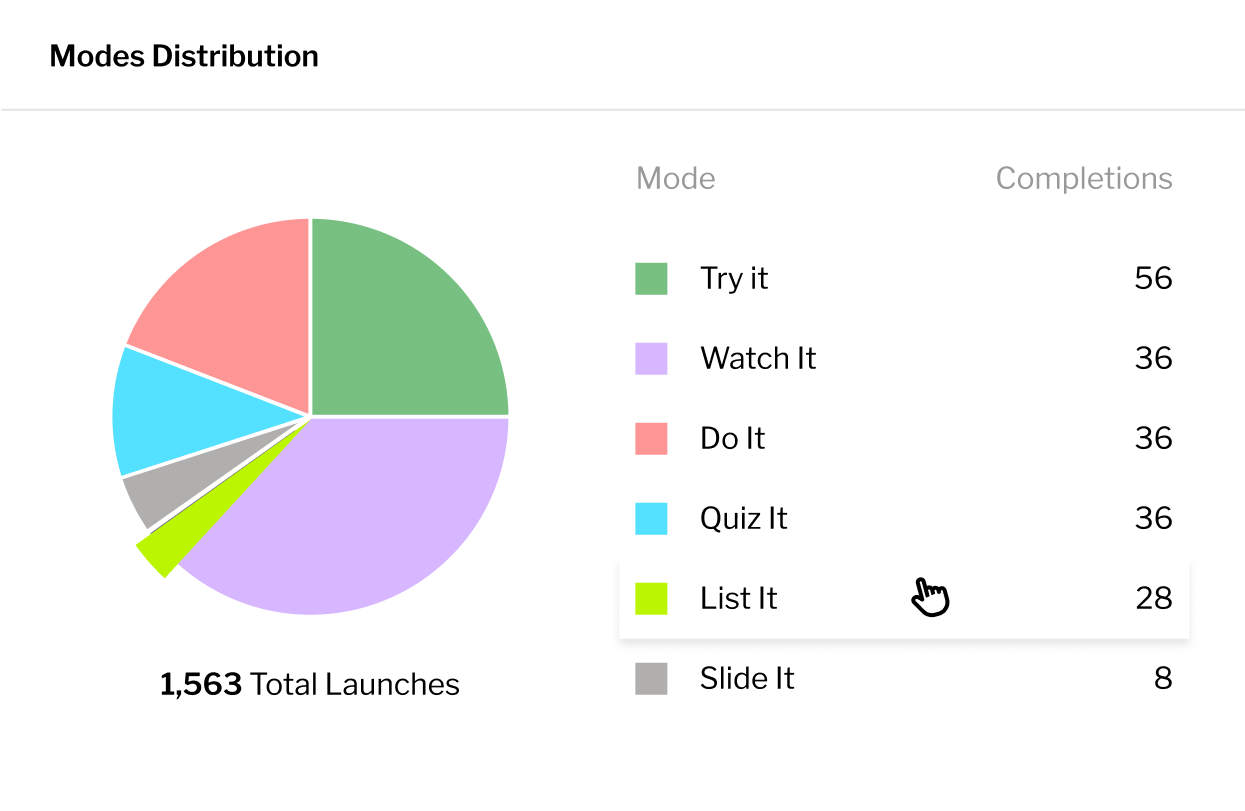
Mode Distribution
See how your learners are interacting with your tutorials by tracking the most popular learning modes.
Track what matters
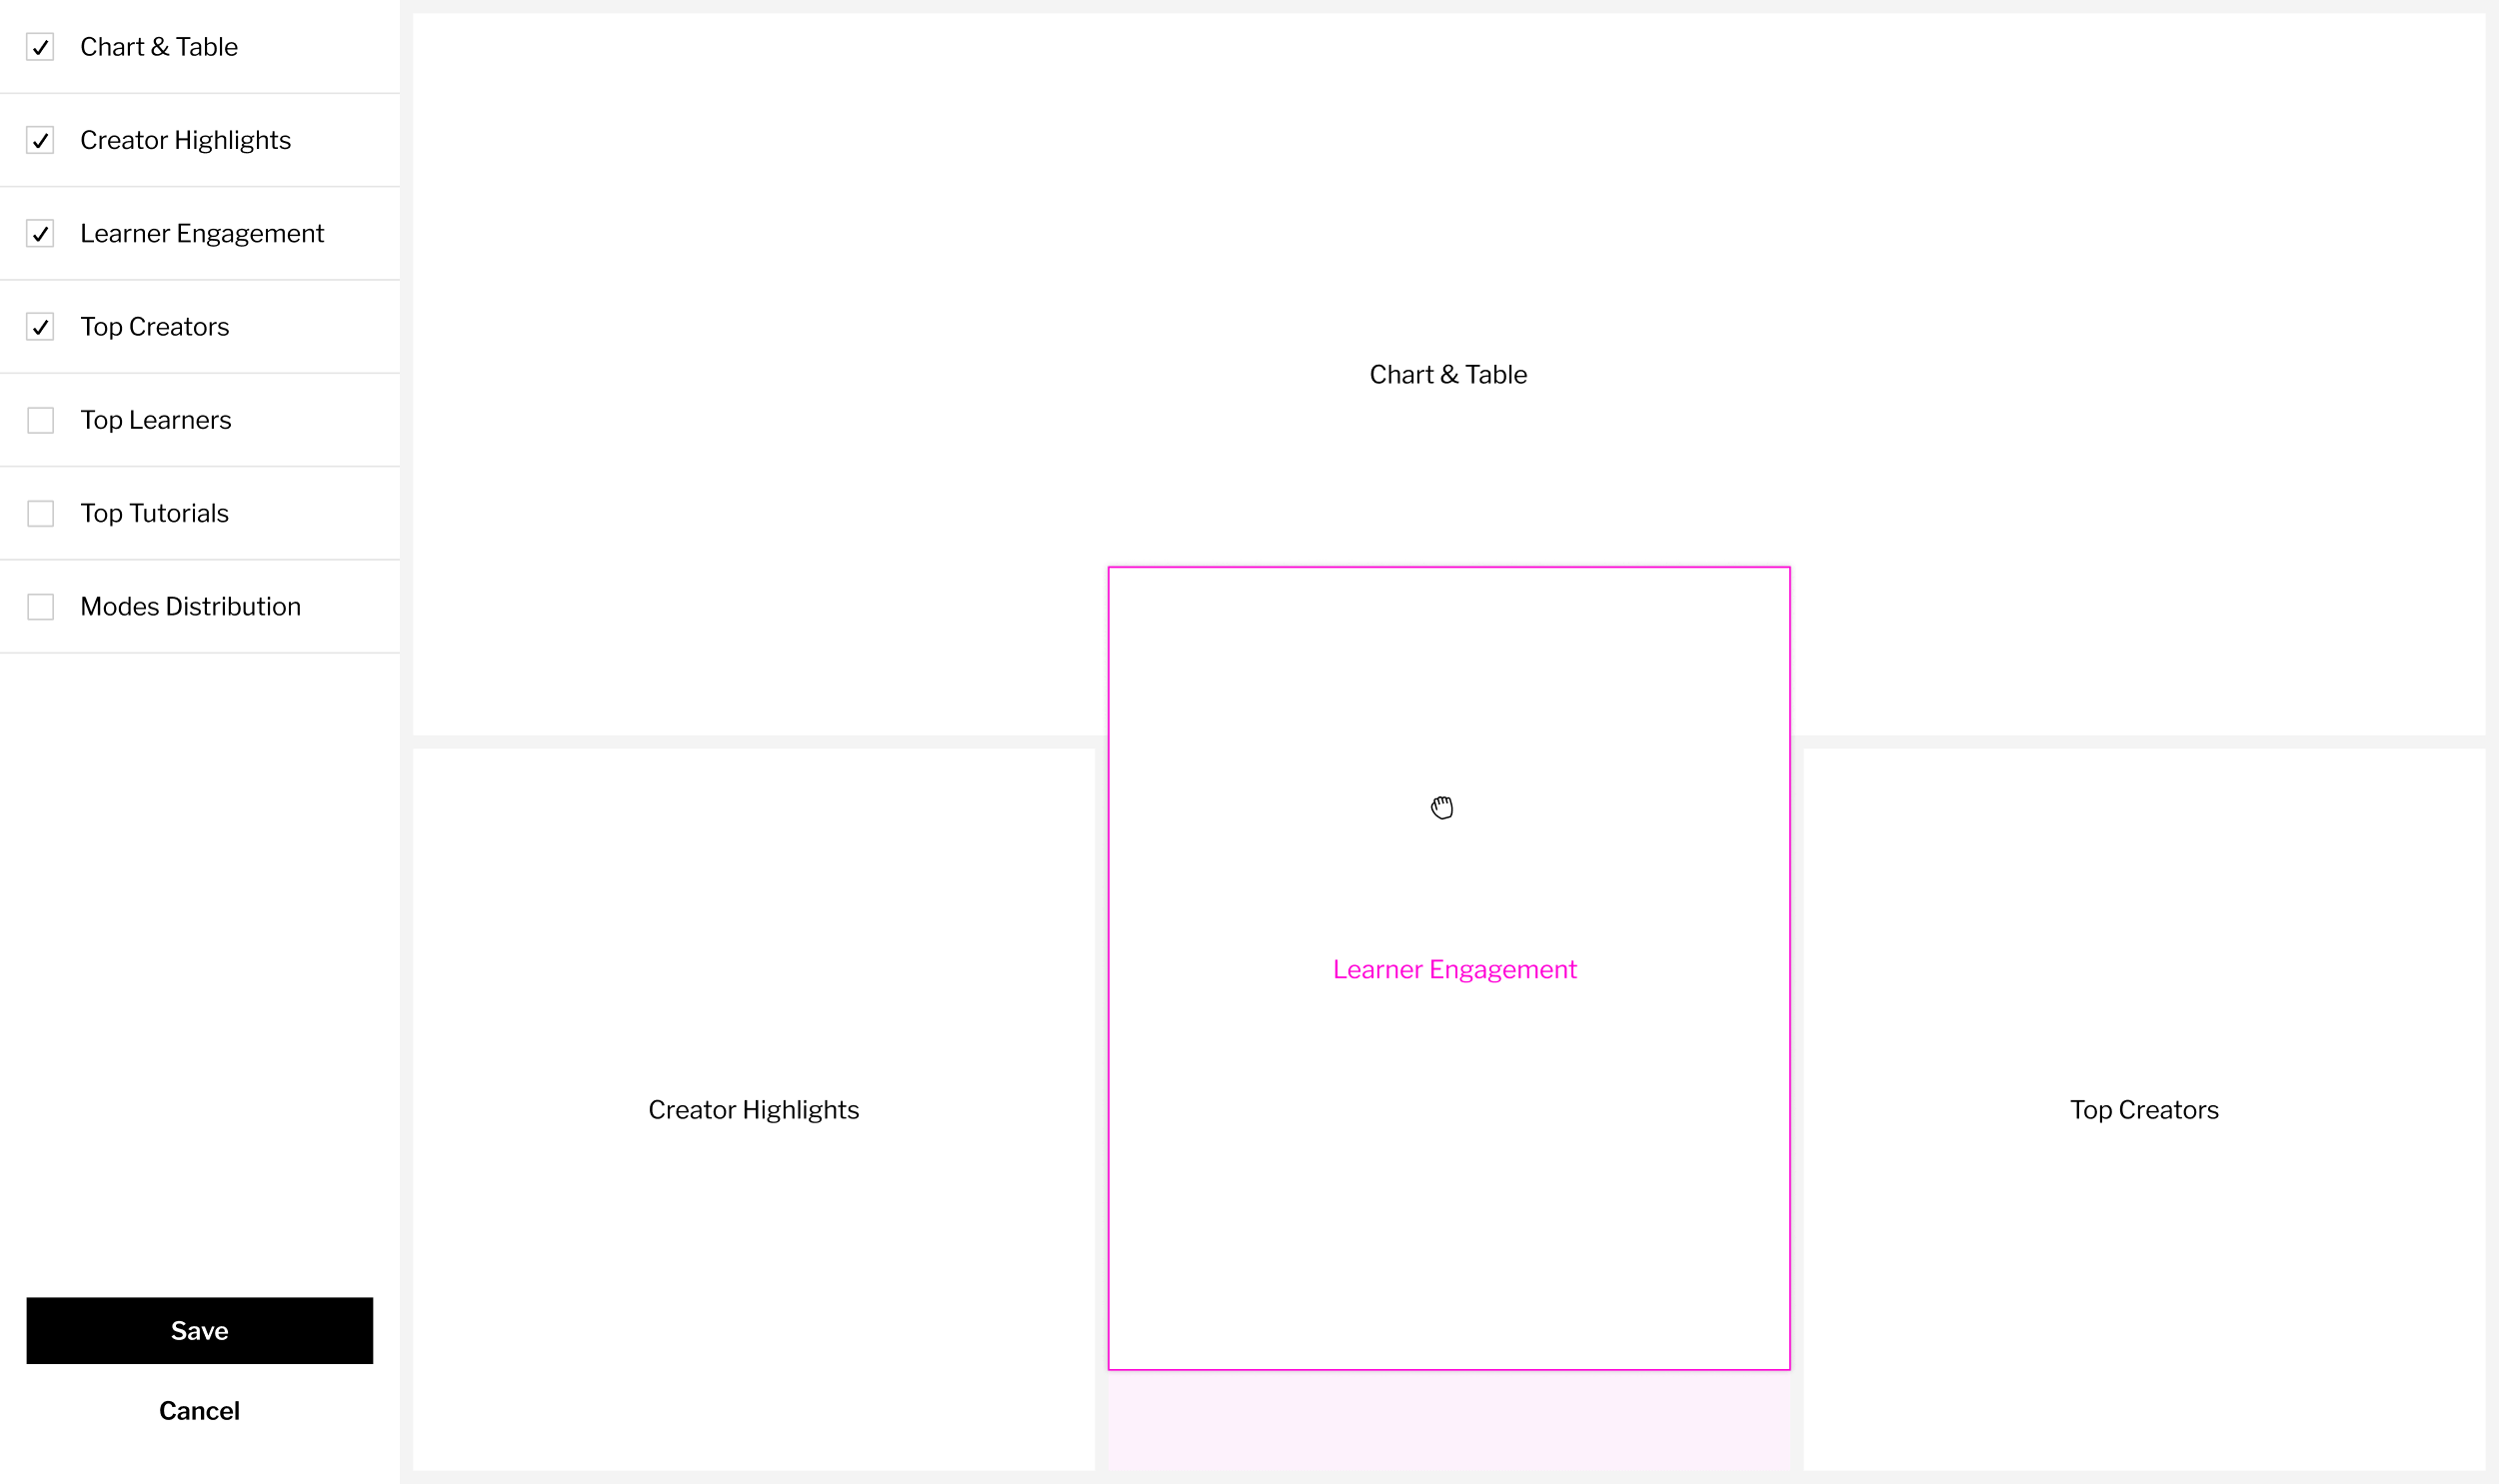
Create multiple dashboards and customize them to fit your specific needs. Select which widgets you want to appear, arrange them in the order you want, and save for easy configuration later. Dashboard presets are a premium-level feature.
