Analytics
Access to detailed tutorial insights with cleaner visuals, more granular filters, and a stronger link to learning outcomes.
Deeper Insights. Smarter Decisions.
Visualize tutorial performance with precision — track launches, completions, drop-offs, and engagement over time.
Analyze your tutorial insights from the top down gain new context into performance over time. Use filters to drill into specific views — track usage trends, learner behavior, and content engagement. Compare performance across different groups of tutorials, teams, or learners with side-by-side metrics and charts.

Available Analytics
Choose from a range of analytics to explore what’s working and what’s not.
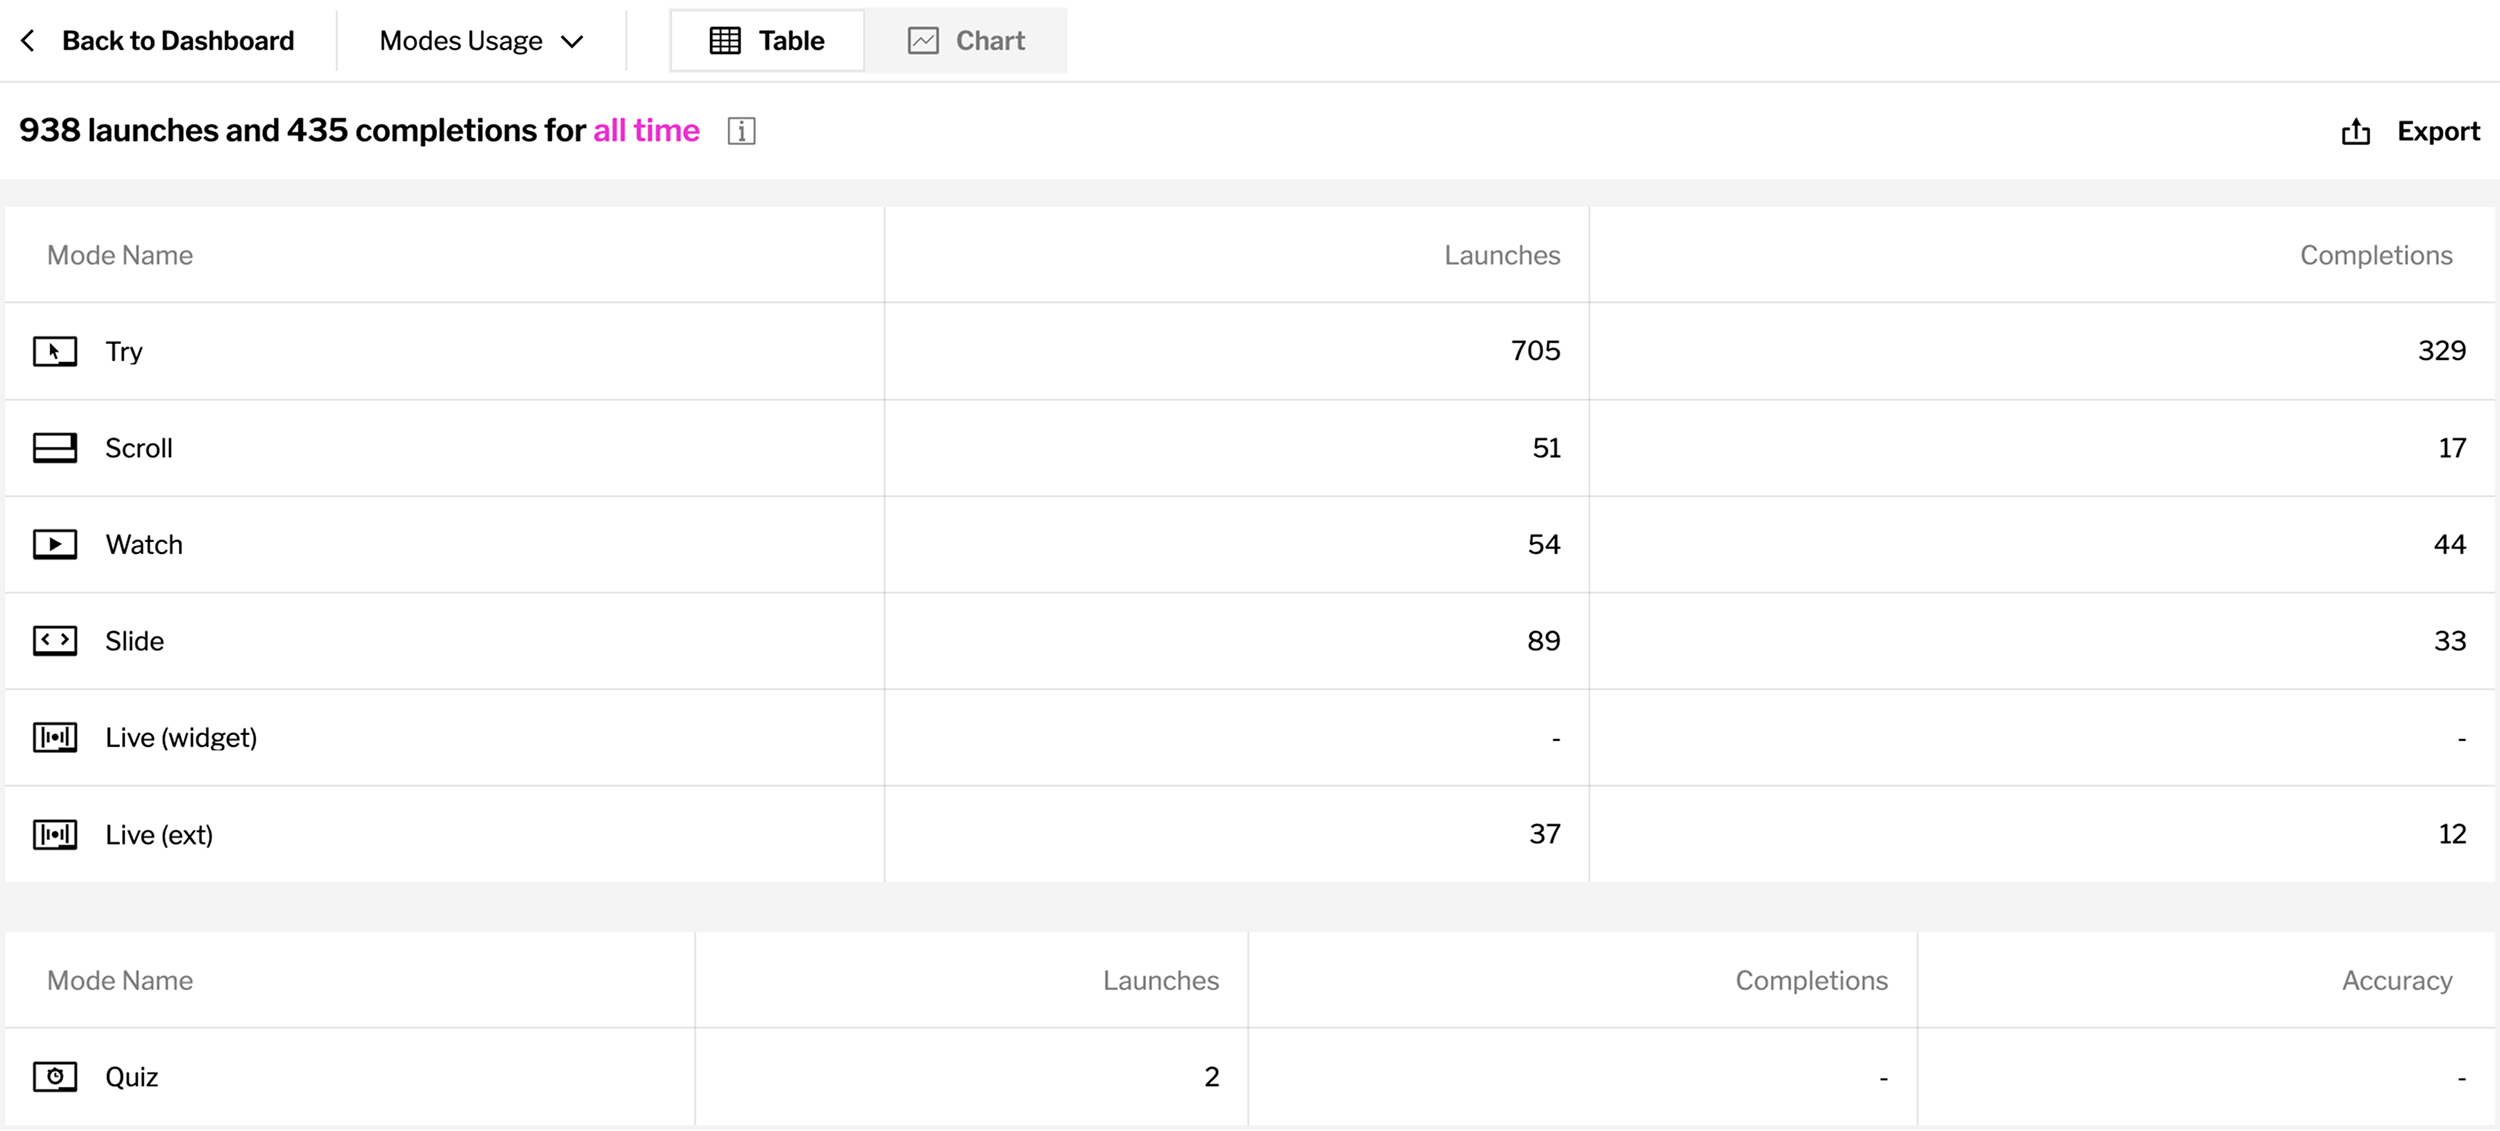
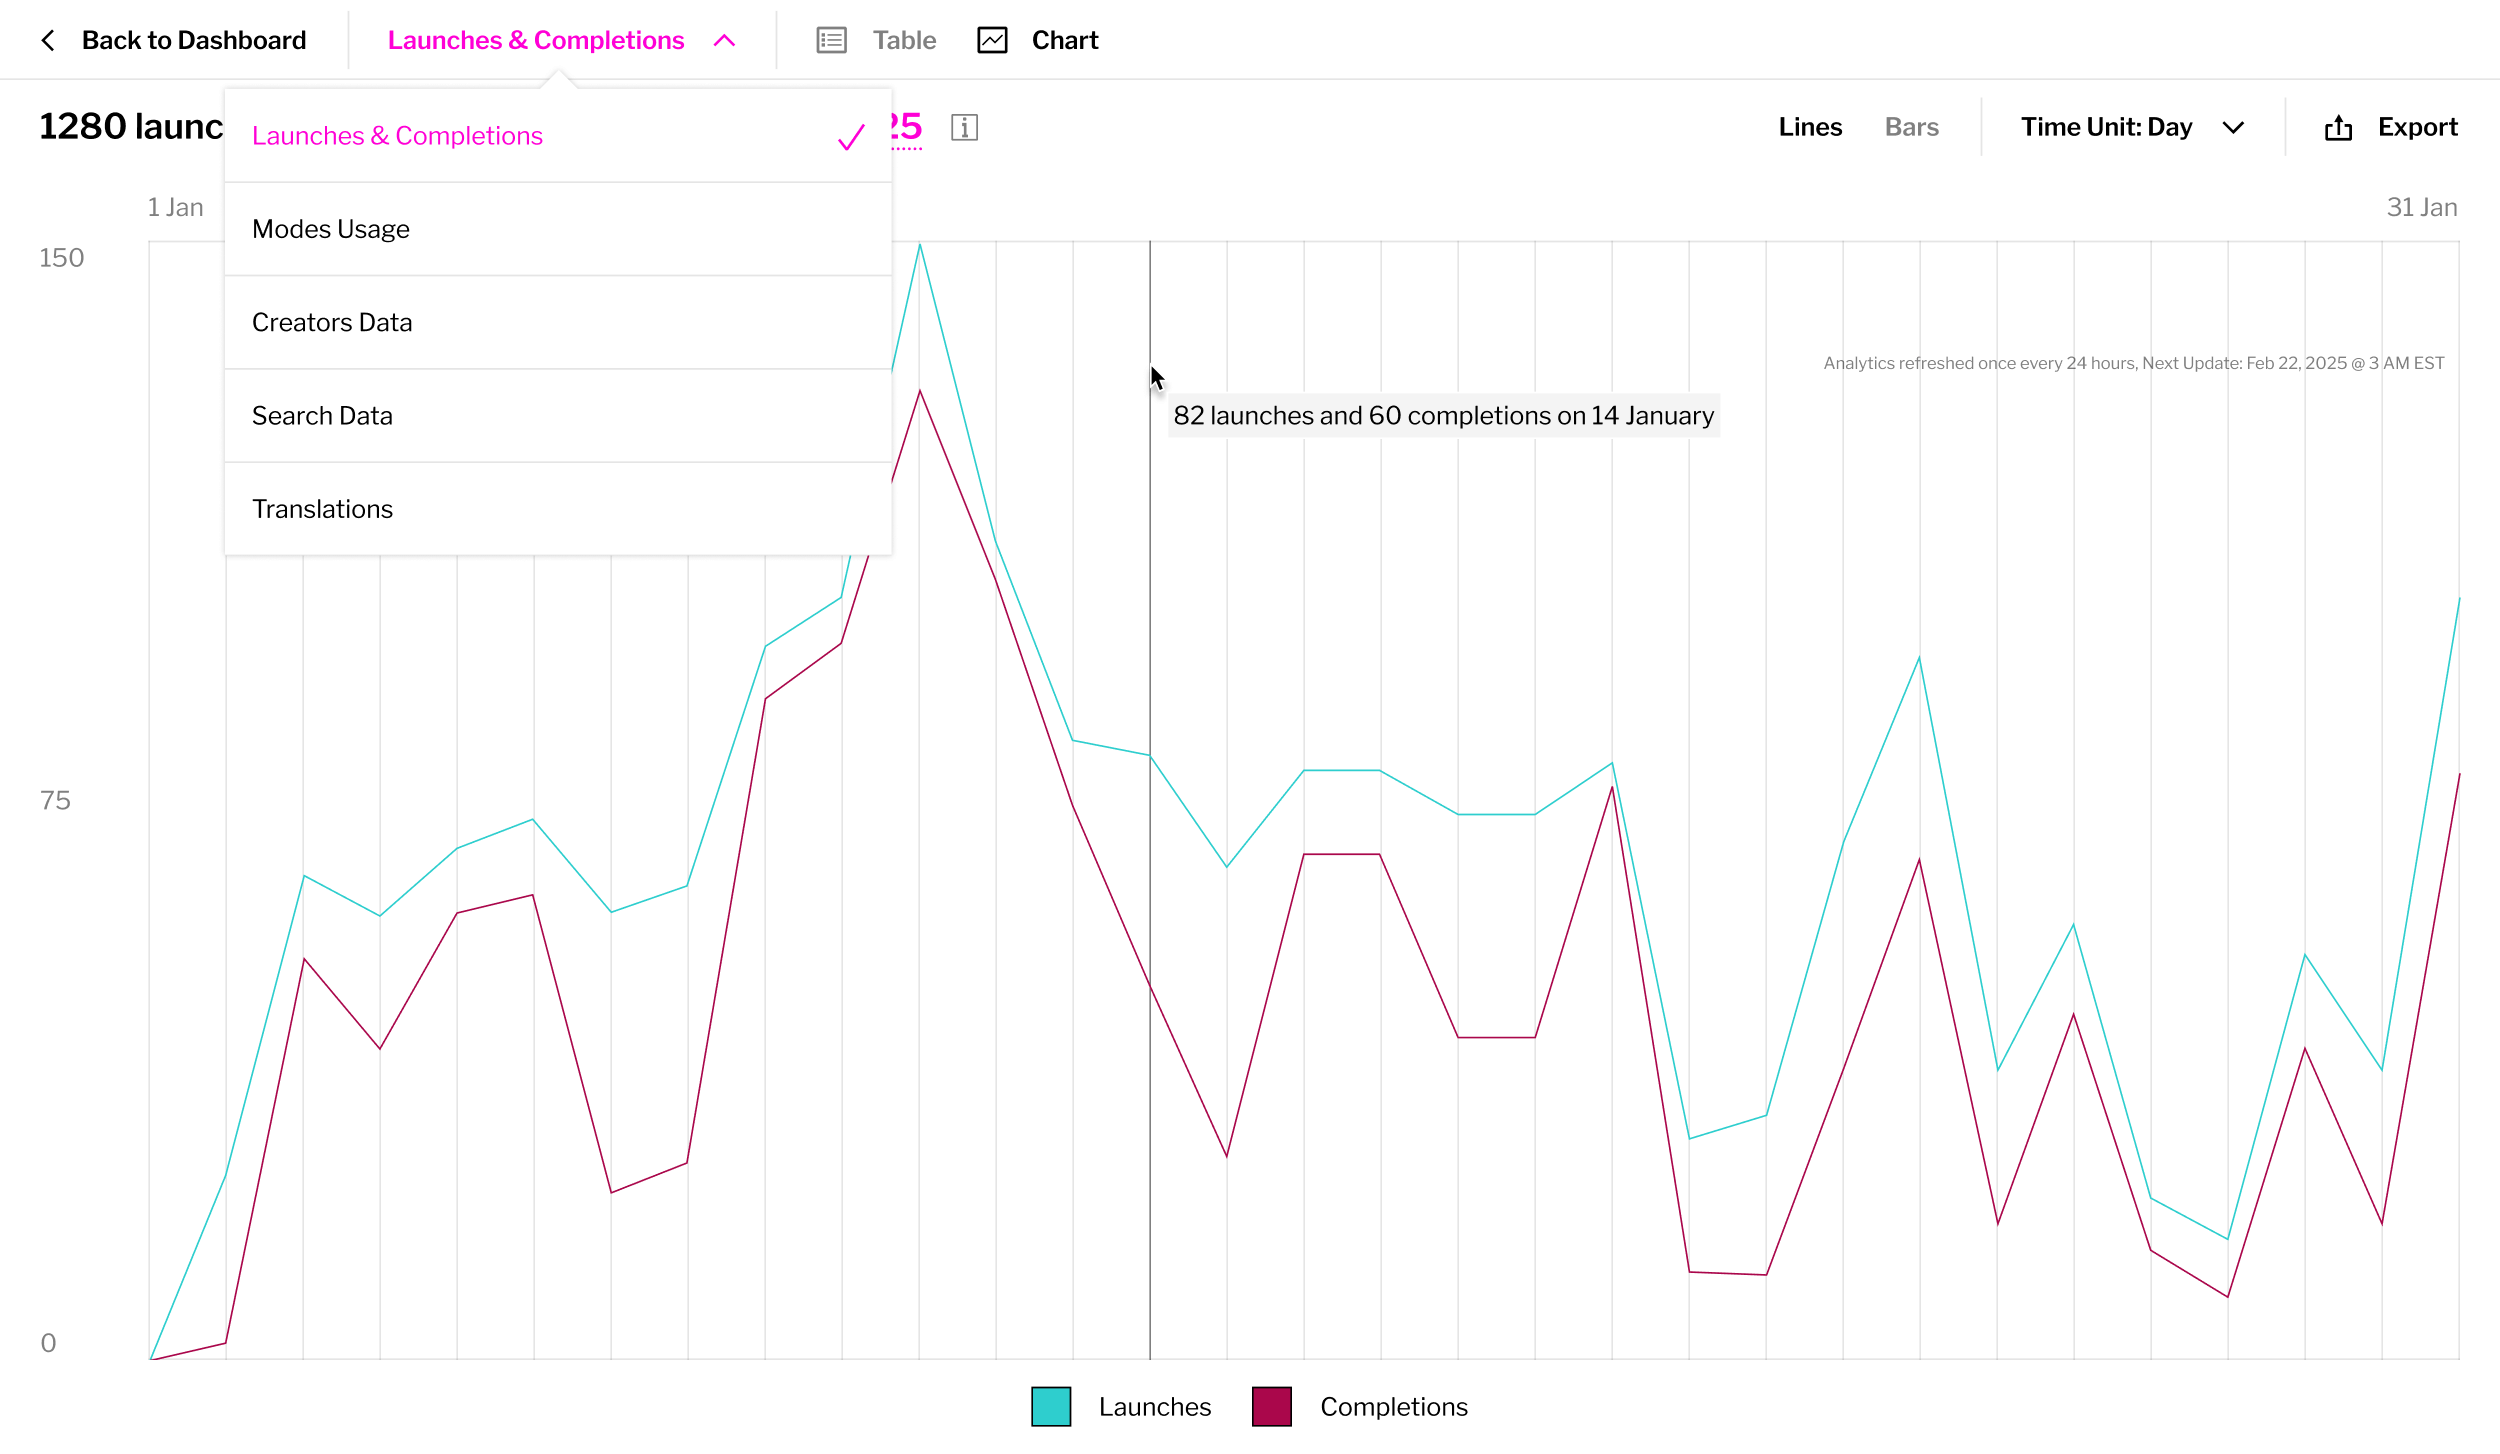
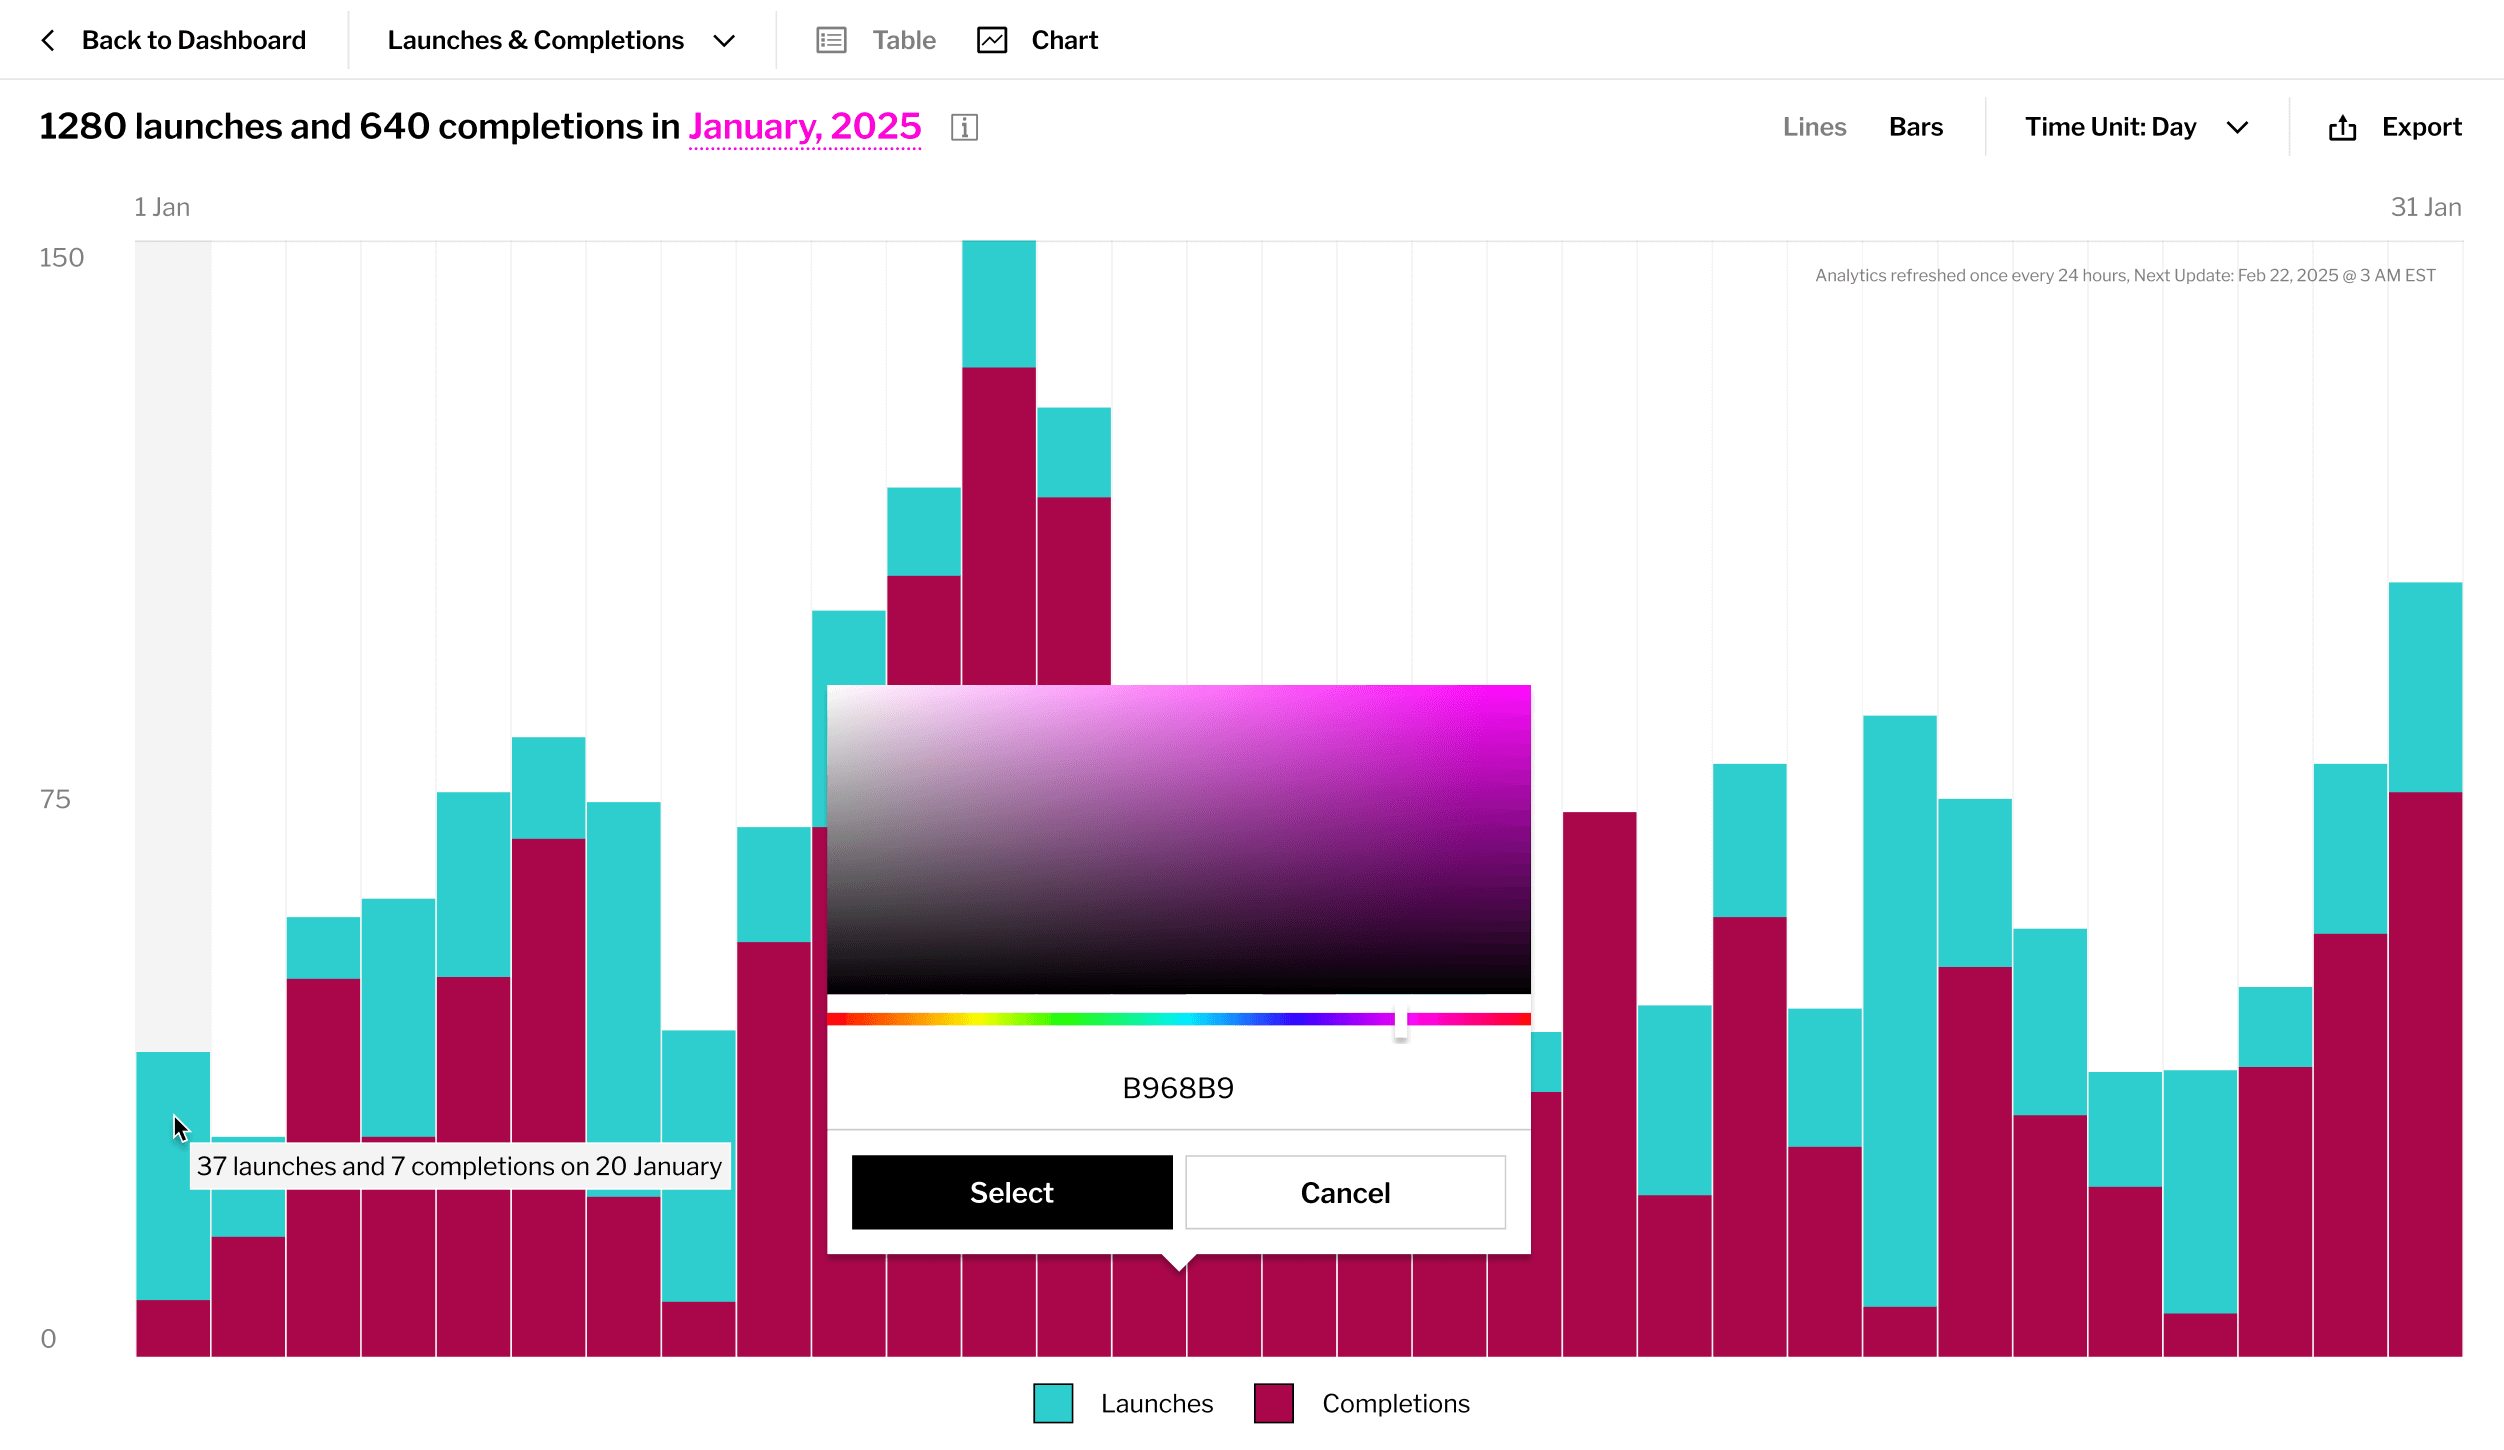
Track Launches, Completions, Modes Usage, Creators Data, Search Data and Translations across any tutorial or group. Capture the big picture or dive into the details with both chart & table layouts.

- Launches & Completions - See how often leaners are launching and completing your tutorials.
- Search Data - See the terms your learners are searching most often and create tutorials to address them.
- Modes Usage - See which learning modes users are choosing when they interact with your tutorials. * Premium plans only
- Creators Data - Access performance data for creators on your team, like tutorials created, views amassed, and more. * Premium plans only
- Translations Usage - See how often your tutorials are being translated and which languages are being selected. * Premium plans only
View Customization
Change how your analytics are displayed by swapping between different table and chart views or changing the timeline.

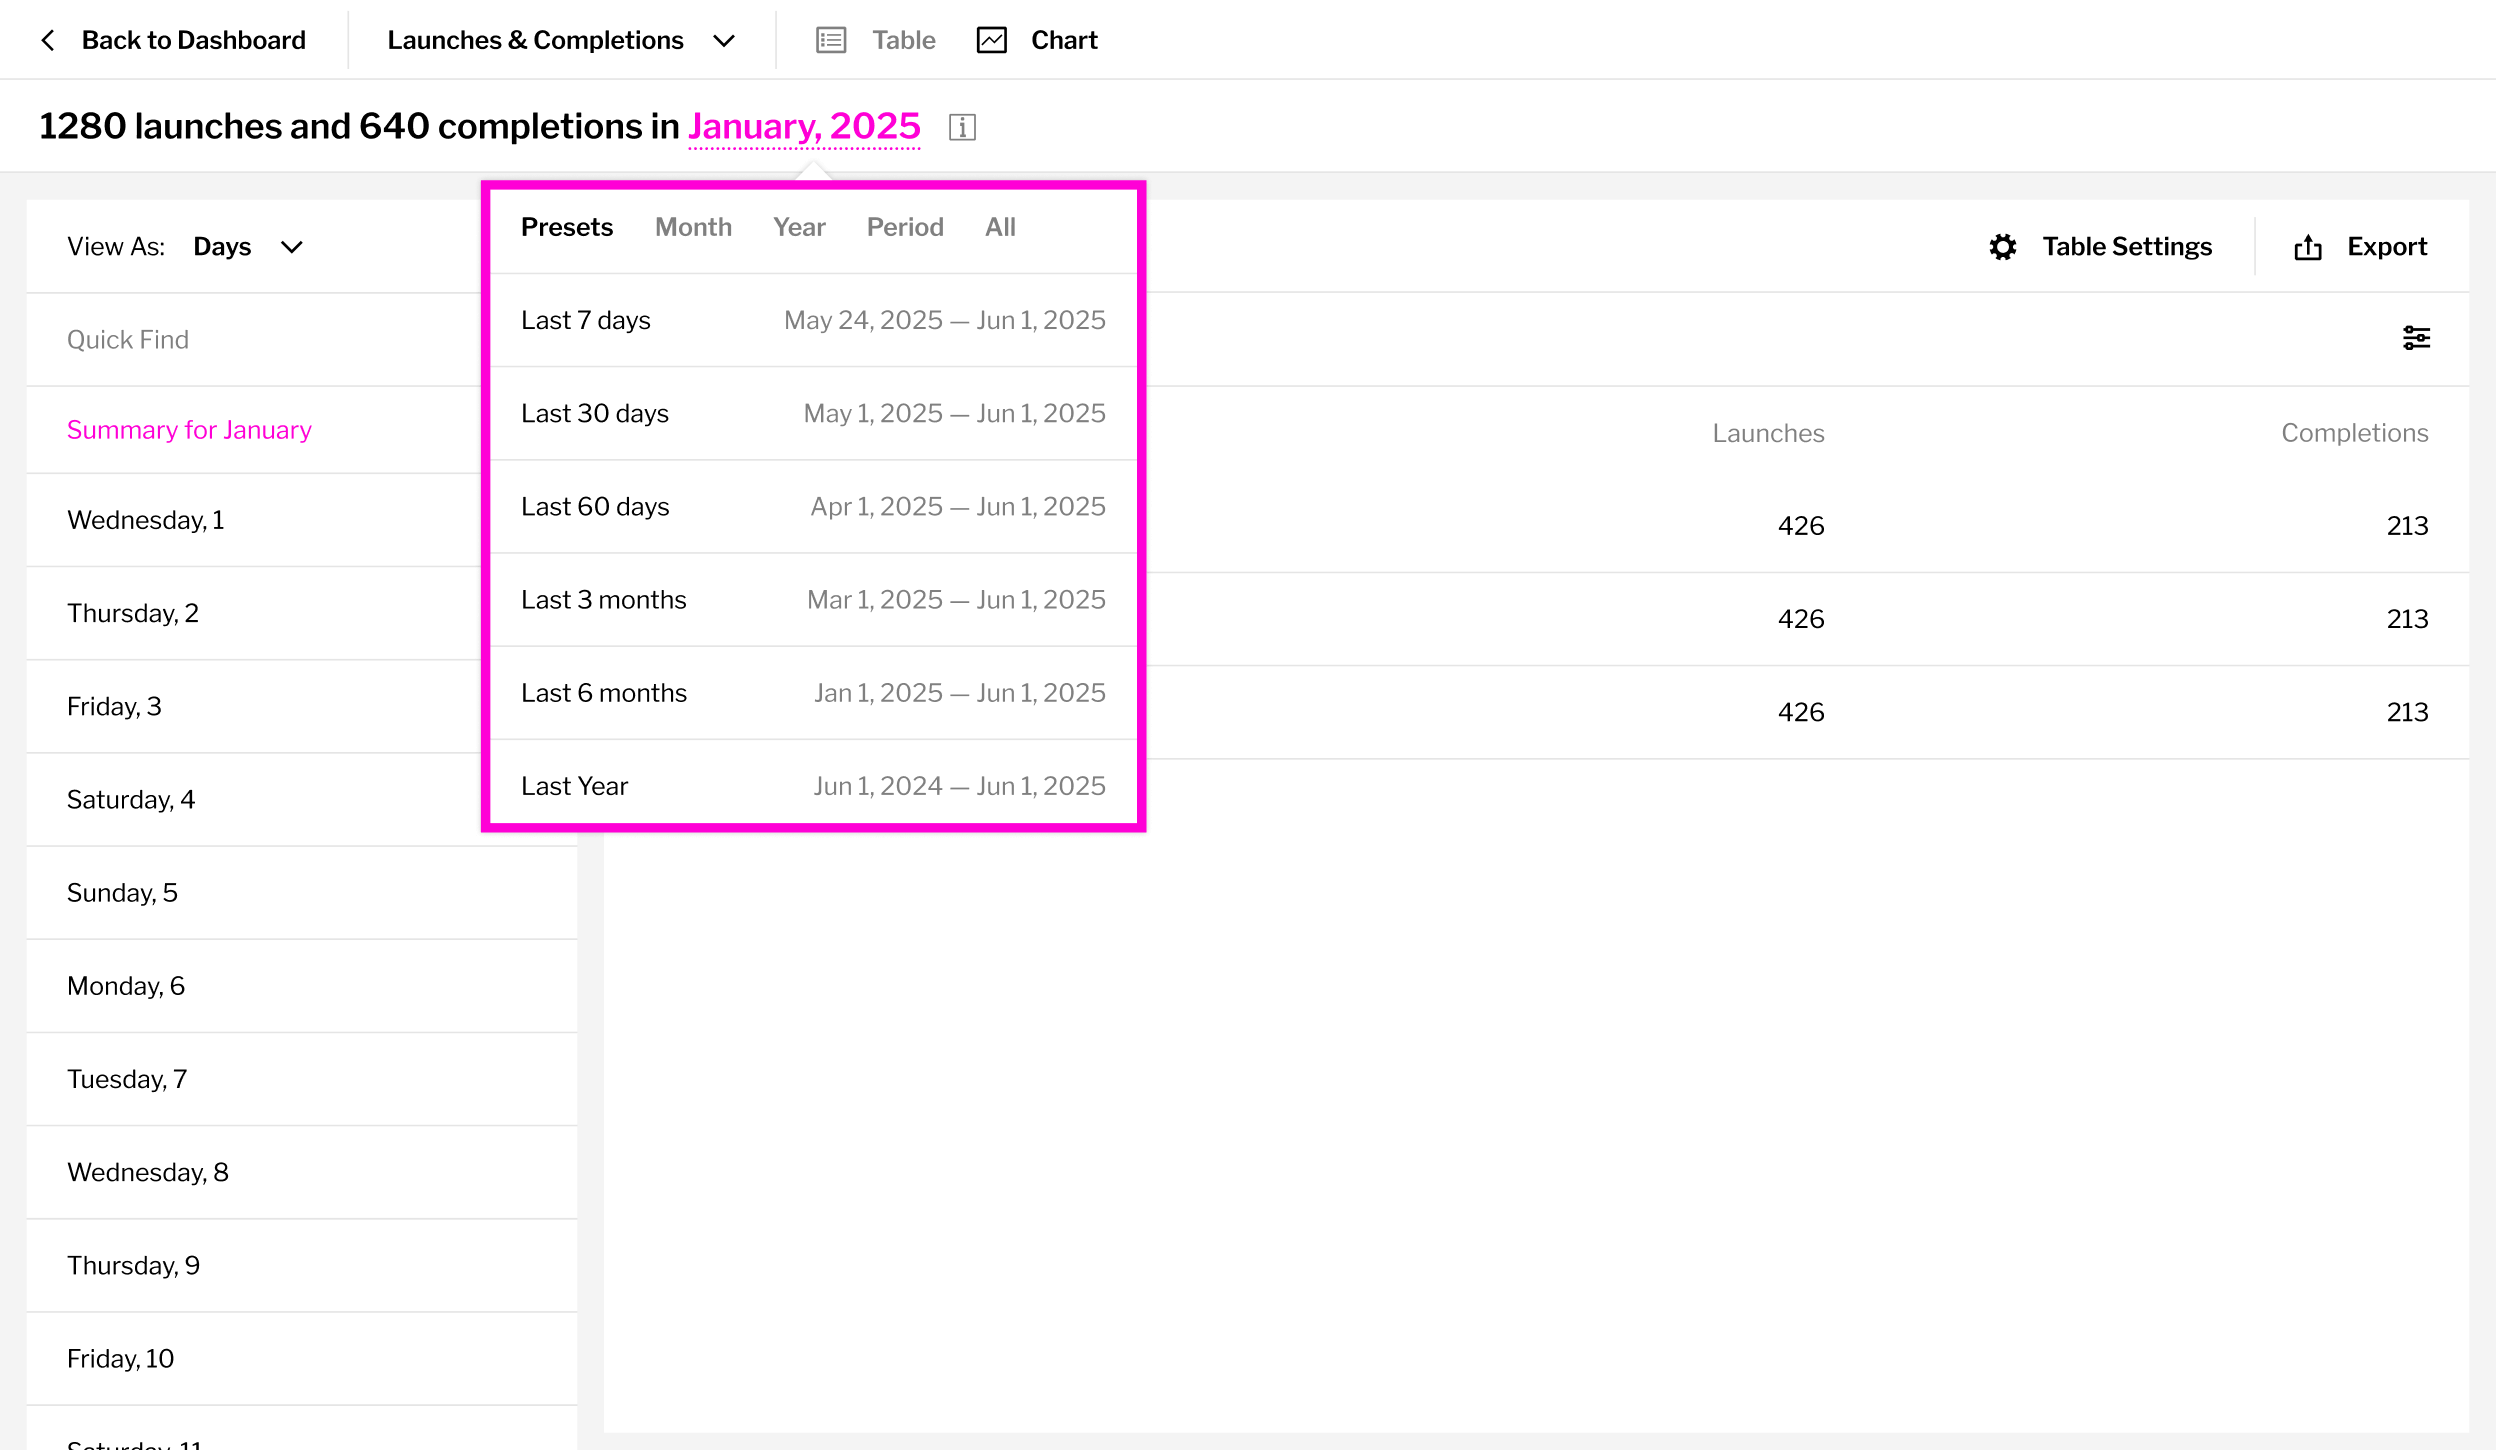
Adjustable Timelines
Zoom in on specific date ranges to spot trends, dips, or surges in activity. Switch between preset views (last 7 days, last 30 days, last quarter) or define a custom timeline. All metrics update automatically to reflect your selection.
Note: data refreshes once every 24 hours.

